

Create the first dashboard to access Victoria Logs in Grafana
Adding the datasource
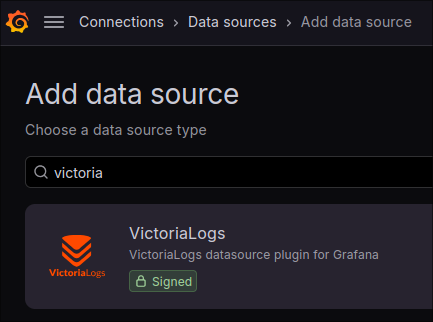
First you need to add the victoriametrics-logs-datasource plugin. Then you can add the datasource.
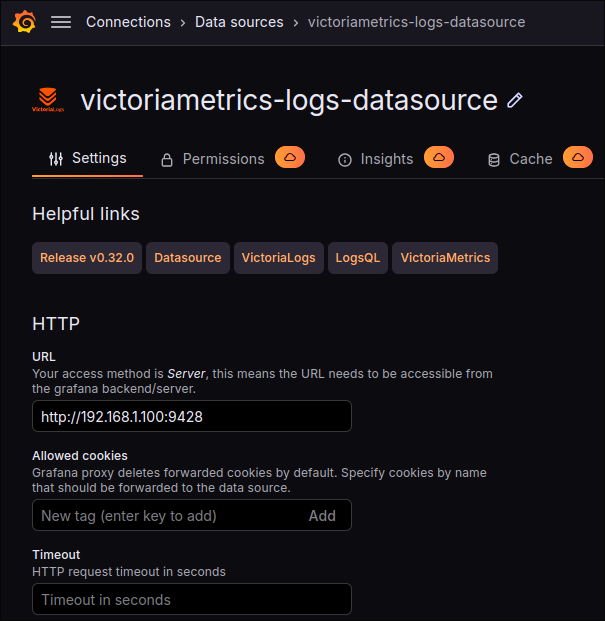
Set the URL, then click on the Save & Test buttom at the bottom of the page.
Create the first dashboard
Now, let’s create a simple dashboard.
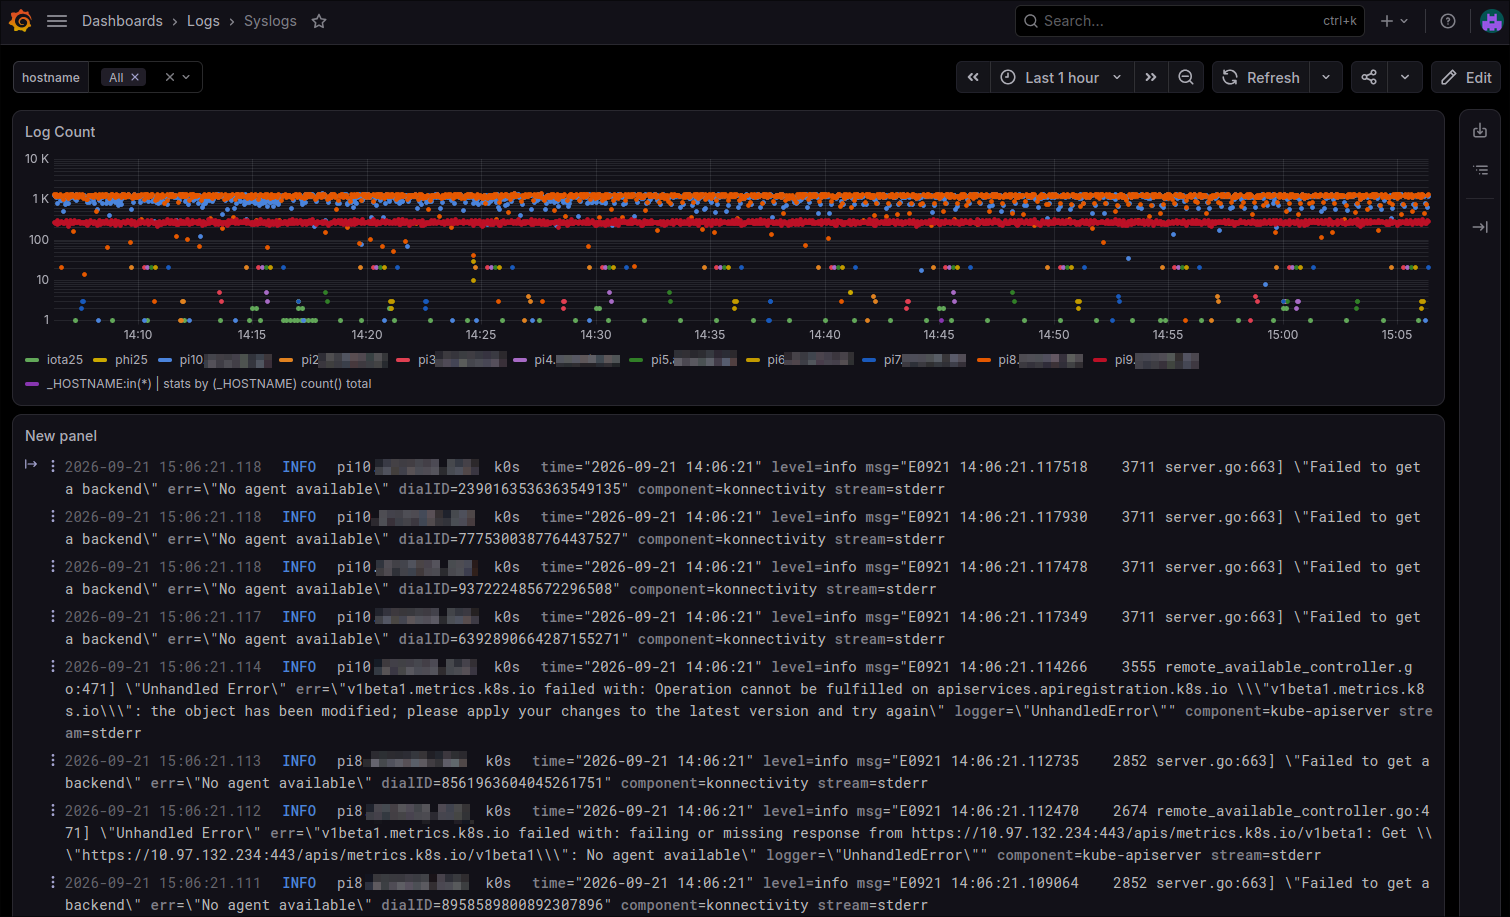
The dashboard contains one variable and two pannels: a simple graph to display logs volume and the logs themself.
Hostname variable
In the dashboard settings, hit the + Add Variable button and select Query.
Set the following parameters
- Name:
hostname - Refresh:
On time range change - Multi-value: ✅
- Include All value: ✅
- Custom all value:
*
Open the variable editor and set the following:
- Target data source:
victoriametrics-logs-datasource - Query type:
field value - Field:
_HOSTNAME - Sort:
Alphabetical (asc)
Click the Run query buttom on the top righ and check the returned values on top.
Finish by clicking on the Apply button on the bottom right.
Logs volume pannel
Create the first pannel, change the type to Time series and set the settings
- Queries / A
- code:
_HOSTNAME:$hostname | stats by (_HOSTNAME) count() total - type:
Raw Logs - legend:
{{ _HOSTNAME }}
- code:
- Pannel Options
- Title:
Log Count
- Title:
- Axis
- Scale:
Logarithmic - Log base:
10
- Scale:
- Graph Style
- Style:
Points
- Style:
- Standard options
- Unit:
short
- Unit:
Logs pannel
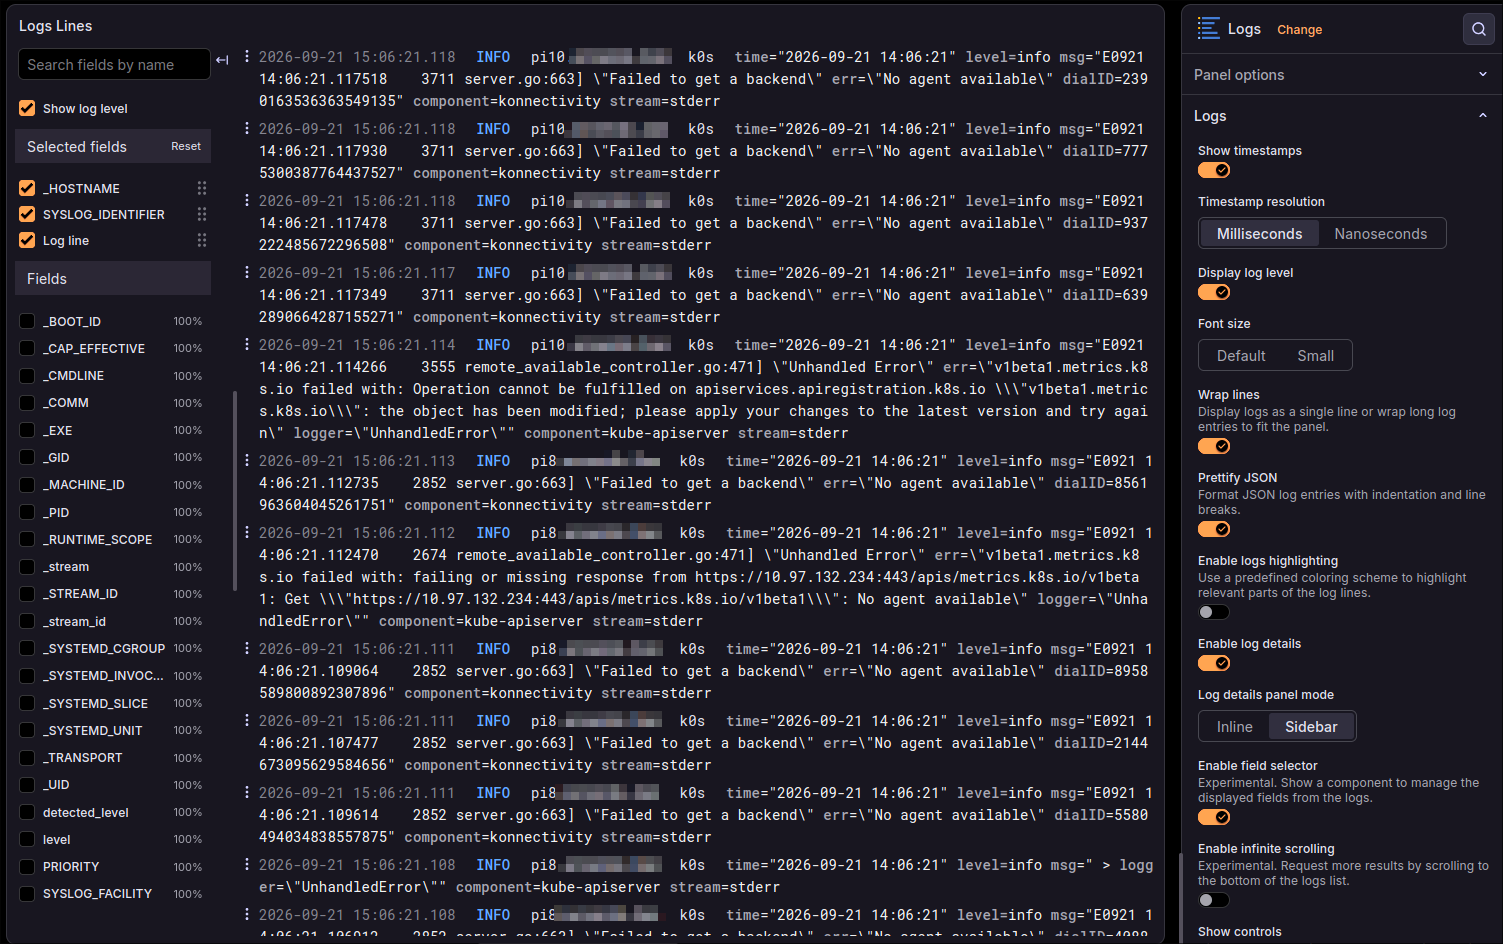
The second pannel, that display logs is simmilar. The type is Logs
- Queries / A
- code:
_HOSTNAME:$hostname - type:
Raw Logs
- code:
- Pannel Options
- Title:
Logs Lines
- Title:
- Logs
- Show timestamps: ✅
- Display log level: ✅
- Wrap lines: ✅
- Enable logs details: ✅
- Enable fields selector: ✅
Expend the field tab on the top left: _HOSTNAME, SYSLOG_IDENTIFIER, Log line
Finally, you can Save, Go Back and Exit Edit